
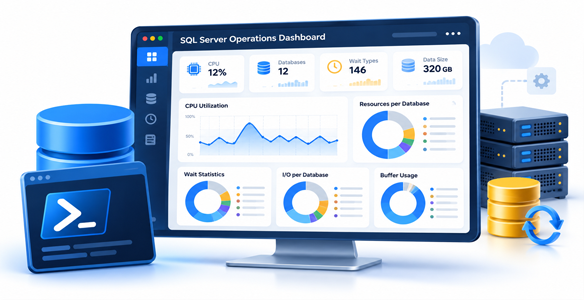
SQL Server Operations Dashboard – PowerShell Monitoring & Reporting
Automated SQL Server health, high availability, performance, backup, Windows infrastructure, and security reporting using PowerShell and PSWriteHTML.
The SQL Server Operations Dashboard is a PowerShell-based monitoring and reporting solution designed to provide a comprehensive operational overview of Microsoft SQL Server environments through a standalone HTML dashboard.
The solution supports both standalone SQL Server instances and High Availability (HA) configurations, including Always On Availability Groups (AOAG). It automatically collects operational information from SQL Server Dynamic Management Views (DMVs), system catalogs, SQL Server Agent history, Windows services, and operating system components.
The collected information is organized into eight dedicated monitoring tabs, combining operational indicators, interactive tables, graphical representations, and detailed diagnostics.
For HA environments, the dashboard presents information from both SQL Server nodes side by side, enabling administrators to compare performance, configuration, availability, and security conditions.
The reporting process is read-only and does not modify SQL Server databases or their configuration.
The Monitoring Framework Covers
-
Automatic collection of SQL Server instance and database information.
-
Support for standalone and Always On high-availability environments.
-
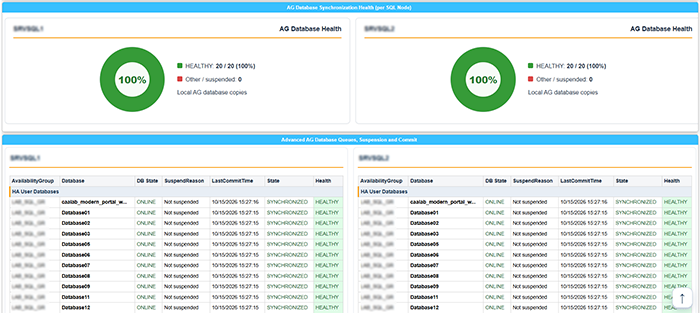
Availability Group replica connectivity, synchronization state, and database health.
-
Database backup freshness, compliance, and restore history.
-
CPU utilization, memory consumption, storage capacity, and database resource distribution.
-
SQL Server wait statistics, I/O latency, and transaction log utilization.
-
Windows Server health, services, Failover Cluster status, and Event Viewer diagnostics.
-
SQL Server error logs, suspect pages, and memory dump indicators.
-
Database security compliance, orphaned users, and privileged database roles.
-
SQL Server configuration comparison across HA nodes.
-
SQL Server Agent job execution duration trends.
-
Database integrity verification history and operational investigation information.
Key Capabilities
SQL Server Operational Overview
-
SQL Server instance identification and inventory.
-
Operational health indicators and status summaries.
-
Database inventory and health information.
-
Operating system information per SQL Server node.
-
SQL Server and host memory consumption.
-
SQL Server-related Windows services and their operational status.
Always On Availability Group Monitoring
-
Availability Group topology and replica roles.
-
Primary and secondary replica connectivity.
-
Replica synchronization state and synchronization health.
-
Database synchronization information.
-
Log send and redo queue statistics.
-
Availability Group listener configuration.
-
Independent database inventory for each HA node.
Backup Monitoring and Compliance
-
Full, differential, and transaction log backup freshness.
-
Configurable backup compliance thresholds.
-
Backup status across queried Availability Group replicas.
-
Standalone database backup compliance.
-
Local backup history for diagnostic purposes.
-
Recent database restore operations.
-
Identification of missing or outdated backup information.
Capacity and Performance Monitoring
-
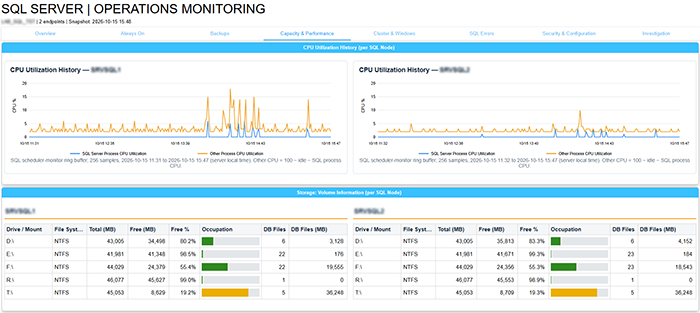
SQL Server CPU utilization history.
-
SQL Server and operating system memory usage.
-
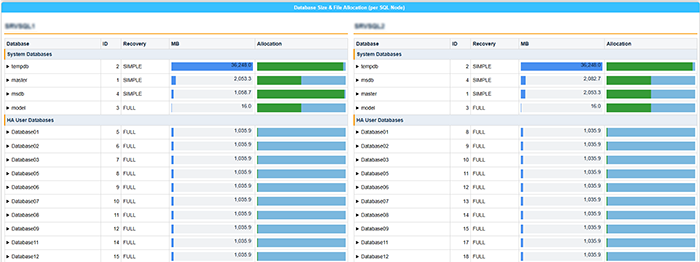
Database size and file allocation.
-
Storage volume capacity and free disk space.
-
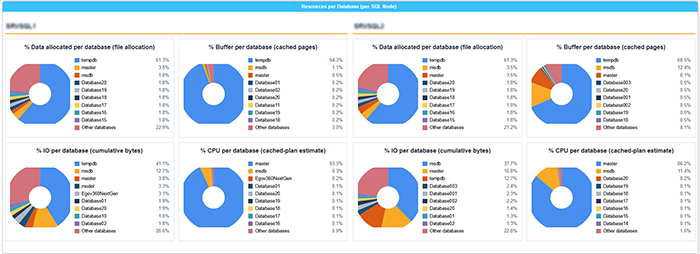
Database resource distribution using graphical charts:
-
Allocated storage per database.
-
Buffer cache utilization per database.
-
I/O activity per database.
-
Estimated CPU distribution per database.
-
-
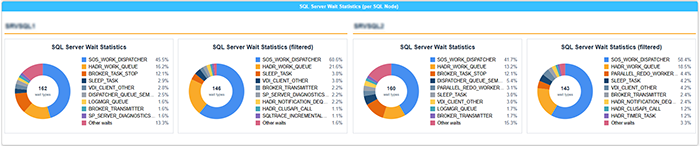
SQL Server wait statistics with graphical representations.
-
Database file I/O latency.
-
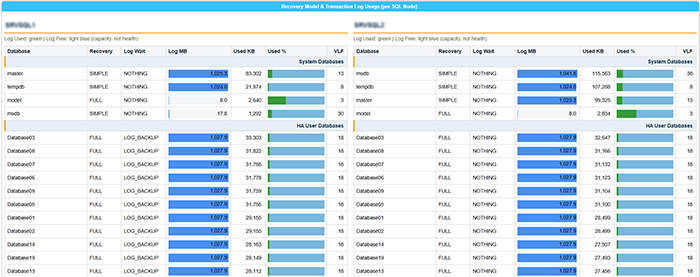
Transaction log usage, recovery models, and VLF statistics.
-
SQL Server memory clerk consumption.
Windows and Cluster Monitoring
-
Windows Server operating system information.
-
Windows Failover Cluster node health.
-
Cluster nodes, resource groups, and ownership.
-
Windows System and Application event log information.
-
Cluster-related DNS and Active Directory events.
-
Windows service availability.
-
Windows local accounts and administrator membership.
SQL Server Error and Diagnostic Monitoring
-
SQL Server error log analysis.
-
Grouped SQL Server error messages.
-
Recent operational errors and warnings.
-
Suspect page detection.
-
SQL Server memory dump indicators.
-
Windows critical events and operational failures.
Security and Configuration Monitoring
-
Database security configuration analysis.
-
Orphaned database users.
-
Privileged database role membership.
-
Database security compliance information.
-
Configuration comparison between HA replicas.
-
Windows user and administrator account information.
-
Identification of configuration differences and potential security concerns.
Operational Investigation
-
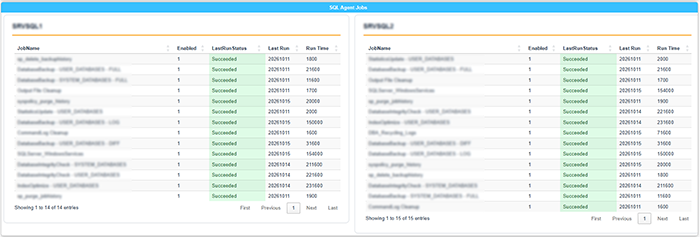
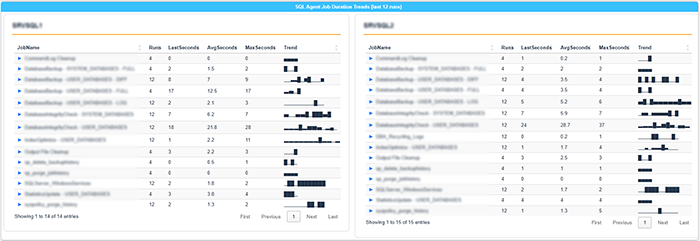
SQL Server Agent job duration trends.
-
Historical database integrity verification evidence (DBCC CHECKDB).
-
Collection errors and permission-related issues.
-
Investigation-oriented operational diagnostics.
-
Identification of information requiring further administrative analysis.
HTML Dashboard Features
The dashboard is generated using PowerShell and the PSWriteHTML module, producing a standalone HTML report.
Its reporting interface includes:
-
Eight dedicated monitoring tabs.
-
Interactive and sortable tables.
-
Pagination and structured data presentation.
-
Graphical CPU utilization history.
-
Donut charts for database resource distribution.
-
Graphical SQL Server wait statistics.
-
Node-aware reporting for HA environments.
-
Configurable monitoring thresholds.
-
Structured operational and diagnostic information.
-
A standalone HTML output that can be reviewed without requiring a dedicated monitoring web server.
Dashboard Sections
1. Overview — SQL Server operational summary, instance inventory, database health, operating system information, and Windows services.
2. Always On — Availability Group topology, replica synchronization, database health, and HA configuration.
3. Backups — Backup freshness, compliance verification, backup history, and recent restore operations.
4. Capacity & Performance — CPU, memory, storage, database sizes, resource distribution, I/O latency, and wait statistics.
5. Cluster & Windows — Failover Cluster health, Windows infrastructure, event logs, and Windows service monitoring.
6. SQL Errors — SQL Server error logs, critical events, suspect pages, and memory dump indicators.
7. Security & Configuration — Database security, privileged users, orphaned users, and configuration comparisons.
8. Investigation — SQL Server Agent job trends, CHECKDB evidence, and monitoring collection diagnostics.
Configuration Options
The PowerShell script provides configurable parameters for:
-
SQL Server endpoints and instance identification.
-
SQL connection and query timeouts.
-
Full, differential, and transaction log backup age thresholds.
-
Disk space warning and critical thresholds.
-
Long-running query and blocking thresholds.
-
I/O latency and transaction log VLF warnings.
-
DBCC CHECKDB history age.
-
Certificate expiration warnings.
-
Availability Group send and redo queue thresholds.
-
Monitoring lookback periods.
-
Windows Event Viewer collection.
-
Windows Failover Cluster information collection.
-
Optional metric history retention.
-
HTML report output location and filename.
Main PowerShell Functions
SQL Server Data Collection
-
Invoke-DbQuery — Executes read-only SQL Server monitoring queries.
-
Get-DatabaseCategory — Classifies databases for structured reporting.
-
Get-ReportNodeLabel — Identifies the appropriate node label.
-
Select-ReportColumns — Selects relevant columns for report presentation.
HTML Reporting
-
New-SafeHTMLTable — Generates report tables.
-
New-NodeAwareTable — Organizes information per SQL Server node.
-
New-DatabaseGroupedTable — Groups database-related information.
-
New-BackupComplianceGroupedTable — Presents backup compliance results.
Graphical Monitoring
-
ConvertTo-CpuSvg — Generates CPU utilization charts.
-
ConvertTo-WaitDonutSvg — Generates SQL Server wait statistics charts.
-
ConvertTo-DbResourcePie — Generates per-database resource distribution charts.
-
ConvertTo-DatabaseSizesHtml — Displays database size information.
-
ConvertTo-FileIoLatencyHtml — Presents file I/O latency information.
-
ConvertTo-MemoryClerkBarsHtml — Visualizes SQL Server memory clerk usage.
Operational Health
-
ConvertTo-KpiHtmlText — Formats operational indicators.
-
ConvertTo-AgHealthCard — Presents Availability Group health.
-
ConvertTo-BackupHealthCard — Presents backup health.
-
ConvertTo-HostMemoryCard — Displays Windows host memory information.
-
ConvertTo-SqlProcessMemoryCard — Displays SQL Server memory information.
System Requirements
-
Windows PowerShell.
-
Microsoft SQL Server connectivity.
-
PSWriteHTML PowerShell module.
-
Windows-integrated SQL Server authentication.
-
SQL Server permissions to access the required DMVs, system catalogs, and monitoring information.
-
Appropriate Windows permissions for remote service, event, account, and cluster information collection.
-
Windows Failover Cluster PowerShell cmdlets where cluster monitoring is required.
Project Files
-
SQLServer-Operations.ps1 — Main PowerShell monitoring and reporting engine.
-
SQLServer-Operations.html — Generated standalone HTML dashboard.
-
Output/ — Directory containing generated report files and optional monitoring history.
Operational Considerations
The solution is intended for operational assessment and troubleshooting rather than continuous real-time monitoring.
The dashboard reflects information collected during script execution, with historical information provided by SQL Server and Windows data sources where available.
Monitoring data availability depends on the permissions, SQL Server configuration, and Windows components accessible to the executing account.
The solution is designed to help database administrators identify operational problems, investigate performance conditions, verify backup compliance, and review HA infrastructure health from a single reporting interface.
